
Doing Business
Fall in love with possibility
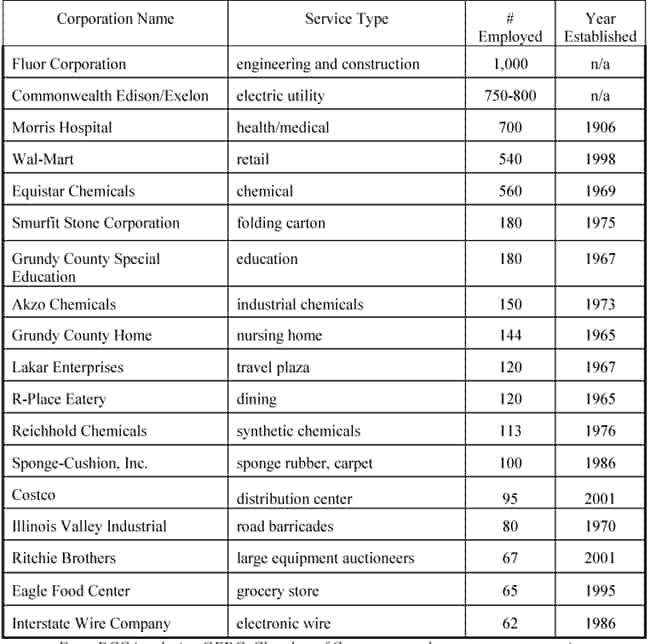
Morris is quite simply a great place to work! With one of the areas top hospitals, Morris Hospital and Healthcare Center employs more than 1000 professionals. Other top employment opportunities include Exelon Generation – Dresden Nuclear Power Station, Walmart, Costco, Procter & Gamble, and LyondellBasell – to name a few.
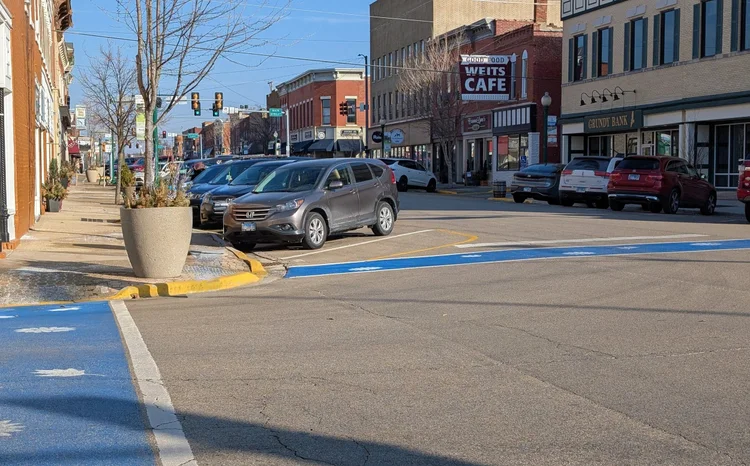
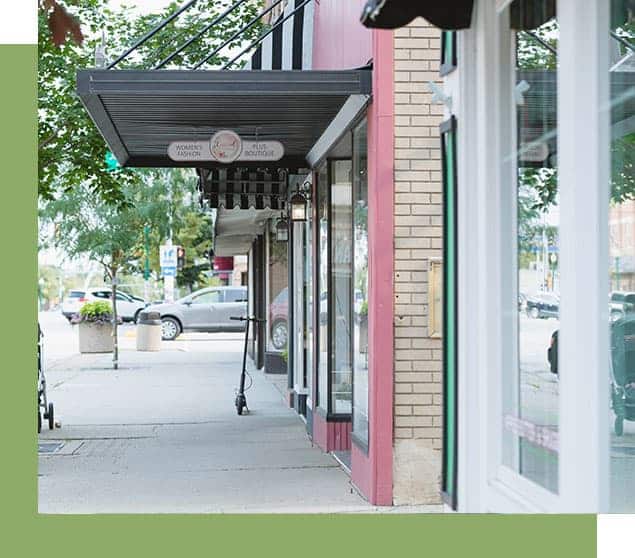
Retail entrepreneurs will appreciate and fall in love with the possibility of opening their own store in our historic and charming downtown area. It’s filled with eclectic and quaint shops, clothing and gift stores.
Thanks to our Chamber of commerce and The Grundy County Economic Development Council both groups continue to be successful and bring quality business, industry and job opportunities to Morris – both large and small!
The business spirit is alive and thriving in Morris, Illinois!


Demographics
POPULATION CHARACTERISTICS
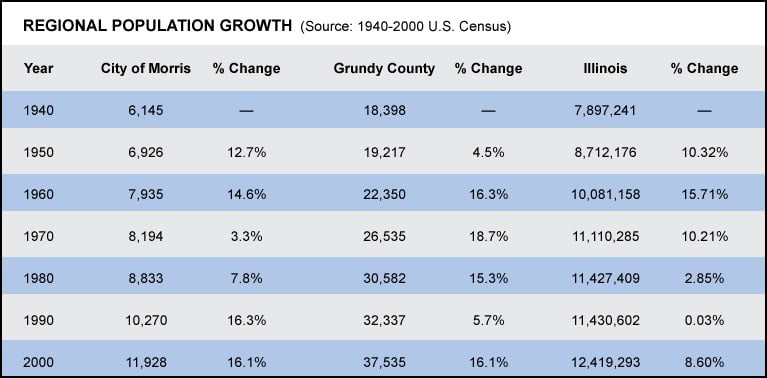
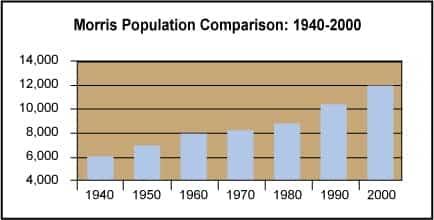
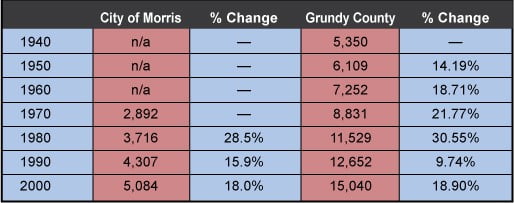
Morris has had a continuing growth in population since 1940. The largest decade of growth occurred during the 80’s with a 16.3 percent increase or 1,437 people. At the same time, Grundy County population increased by 1,755, an increase of only 5.7 percent. Apparently, much of the increase in population for Grundy County occurred in Morris. The smallest percentage growth in a decade for Morris happened in the 60’s, as a 3.3 percent increase pushed the population of Morris up by only 259. At the same time, the county population increased by 4,185 or 18.7 percent. Morris and the county do not show any signs of slowing or decreasing in population. Since 1980, Morris has shown a 35 percent increase in population and the county a 22.7 percent increase. The population growth continued in the 90’s, as the rate increase was 16.1 percent for both Morris and Grundy County.
Morris has had a continuing growth in population since 1940. The largest decade of growth occurred during the 80’s with a 16.3 percent increase or 1,437 people. At the same time, Grundy County population increased by 1,755, an increase of only 5.7 percent. Apparently, much of the increase in population for Grundy County occurred in Morris. The smallest percentage growth in a decade for Morris happened in the 60’s, as a 3.3 percent increase pushed the population of Morris up by only 259. At the same time, the county population increased by 4,185 or 18.7 percent. Morris and the county do not show any signs of slowing or decreasing in population. Since 1980, Morris has shown a 35 percent increase in population and the county a 22.7 percent increase. The population growth continued in the 90’s, as the rate increase was 16.1 percent for both Morris and Grundy County.
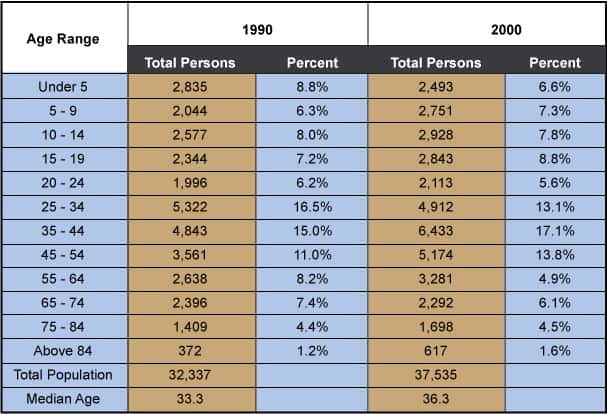
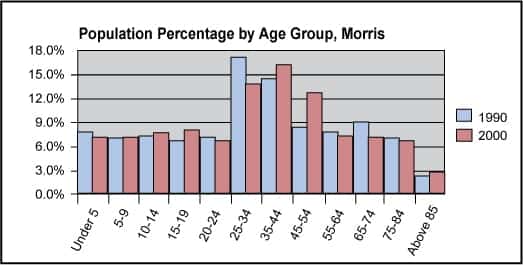
Grundy County also saw a sharp increase in its median age. It went from 33.3 to 36.3 years of age. The state’s median age for 2000 of 34.7 was 2.2 years younger than the residents of Morris and 1.6 years younger than the median age of Grundy County. Both populations are becoming considerably older.
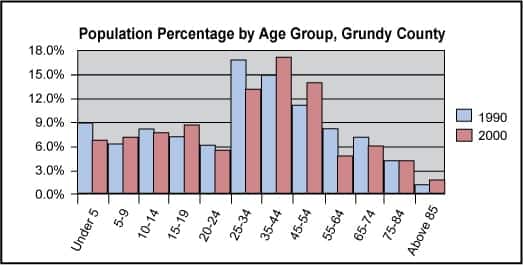
The age group for Grundy County that saw the largest percentage increase was also the 45-54 group at 2.8 percent. The 35-44 age group made up the largest percent of the county adult population in 1990 and 2000 at 15.0 percent and 17.1 percent. The age group that saw the largest percent decrease was the 25-34 group at a 3.4 percent decrease followed closely by the 55-64 group at 3.3 percent.
The population characteristics of Morris closely resembled those of Grundy County. Each has seen a decline in those between the ages of 0-10, followed by a rise between the ages of 15-19. Both have felt a drop in the percentage of people aged 20-34. However, as would be expected of an aging population, there is a sharp increase for the age group 35-54. This helps indicate the number of college-aged people and young professionals who are leaving Morris and Grundy County.
The percentage of the county population Morris accounted for decreased from 1980 to 1990. In 1980, Morris made up 40.7 percent of the county population, while in 1990, Morris only made up 31.8 percent of the county population. The town continues to account for 31.8 percent of the county population in 2000. These numbers show that while Morris and Grundy County populations grow, Morris is not the only area that is growing.

HOUSEHOLD CHARACTERISTICS
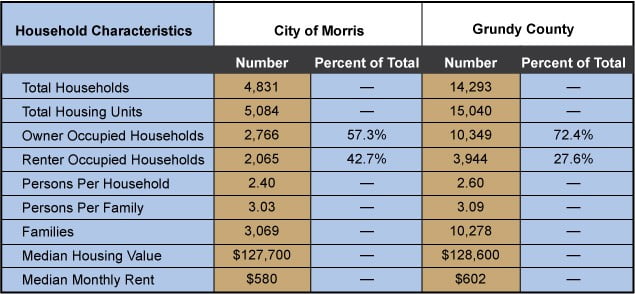
The number of persons per household for Morris decreased slightly from 1990 to 2000 from 2.42to 2.40. The State of Illinois has an average of 2.63 persons per household. Morris has slightly less people per household than Grundy County, 2.40 and 2.60 respectively. The cause of this decrease may be a combination of the increased number of elderly living alone and the increasing number of single parent families. The difference between Morris and Grundy County may be accounted by the number of apartments and rental units available in Morris being larger than in the rest of the county. This is shown below by the difference between Morris and Grundy County on the percent of renter-occupied housing units (42.7 and 27.6 respectively). Morris accounted for over half of the number of renter-occupied units in the county and 26.7 percent of the owner-occupied housing units. The median home value increased 74.9 percent over the last decade in Morris, an increase that creates the need for affordable housing. The rate, 79.6 percent, was even more pronounced in Grundy County. Median gross rents increased 46.4 percent in Morris and 46.8 percent for Grundy County.
As seen in the table to the right, the number of housing opportunities in Morris has had a constant increase from 1960 to 2000. Grundy County has had an increase in housing units since 1940 with the largest increase occurring during the 70’s. The increase in housing units in Morris (824) during the 70’s accounted for 31 percent of the increase in units in Grundy County (2,698). During the 80’s, Morris accounted for 51 percent of the county’s increase in units. Currently, Morris contains 33.8 of the housing units in Grundy County.
NEW CONSTRUCTION PERMITS
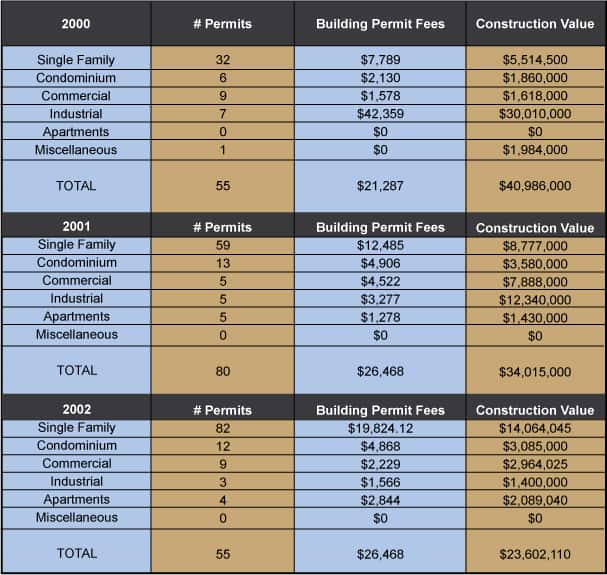
The table to the right shows the number of building permits issued for new construction from 2000-2002. Building permit fees and total construction values are also listed. The number of permits issued for 2002 is the same as the 2000 level. The building permit fees have risen over the last few years, while the total construction value has gone down each year.
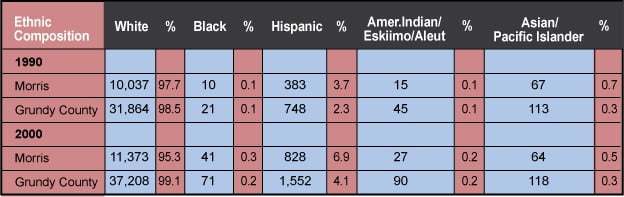
ETHNIC COMPOSITION
Morris is made up predominately of White residents with Hispanics being the next largest population group. The Hispanics in Morris make up 51% of that race in Grundy County. The number of Hispanics more than doubled from 1990 to 2000. The area is becoming slightly more diverse, with an increase in Blacks and American Indian/Eskimo/Aleutians.
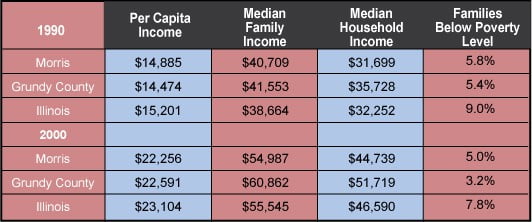
INCOME LEVELS
The per capita income of Morris is only 1.5% lower than Grundy County. Morris also has lower levels of median family income and median household income when compared to Grundy County. Prior to figuring inflation, Morris’ median family income increased 35% and the median household income increased 41%. Both of these increases are below the state average. Morris has a higher level of population below the poverty level than Grundy County. The overall economy was generally solid during the last decade, explaining a portion of these increases. People can be more selective in choosing employment when the competition for most jobs is not as intensive. This also indicates that people have more disposable income, making Morris an increasingly popular place to live for families moving away from the Chicago metro area.
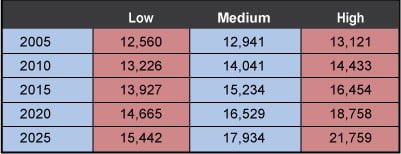
POPULATION PROJECTIONS
The City of Morris has grown at unprecedented levels the last two decades. The city has seen a 35 percent increase in population between 1980 and 2000. The table below projects future population levels based on three separate scenarios. The low estimate uses the average rate for Grundy County growth through 2020. This rate would be nearly half the rate of the last two decades for Morris. A low estimate would mean a strictly controlled pattern of growth by encouraging more infill development. New development would generally occur along existing corridors and where existing infrastructure is already sufficient. It encourages a greater awareness and preservation of agricultural and conservation land. This would also dictate a leveling of population levels in Grundy County and areas southwest of Chicago.
A medium rate assumes population growth at a rate equal to that of the last two decades in Morris. It is also based on the number of residential and commercial permits issued within the last six years. This would dictate residential development occurring primarily to the west and north of the current city limits. Some additional industrial and commercial development would result, particularly north of I-80. This rate takes into account the current patterns of growth while figuring that new development would occur north of the Illinois River.
A high rate dictates an unusually rapid surge in population growth. This assumes that an extended commuter rail line will pass through Morris, linking LaSalle and Joliet. It also figures that annexations along with residential and commercial development will follow shortly following the completion of the new Illinois 47 bridge across the Illinois River. The rate should be viewed as a probable overestimation. It is used as a benchmark for controlling growth and to understand what peripheral options could do to the size of the city. It also dictates policy that extends water and sewer service to previously undeveloped areas of the 1½ mile planning area and encourages population growth.
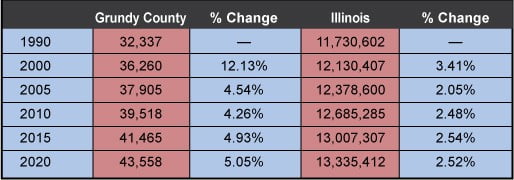
The table to the right (bottom) shows population projections for Grundy County and the State of Illinois and is provided by the Illinois Department of Commerce and Community Affairs (DCCA). The county population is projected to rise at a rate approximately twice that of Illinois. Growth would remain fairly consistent through the next two decades. DCCA projections are generally viewed as conservative. The actual population for Grundy County for 2000 was moderately higher than was projected.
ECONOMY (present situation)
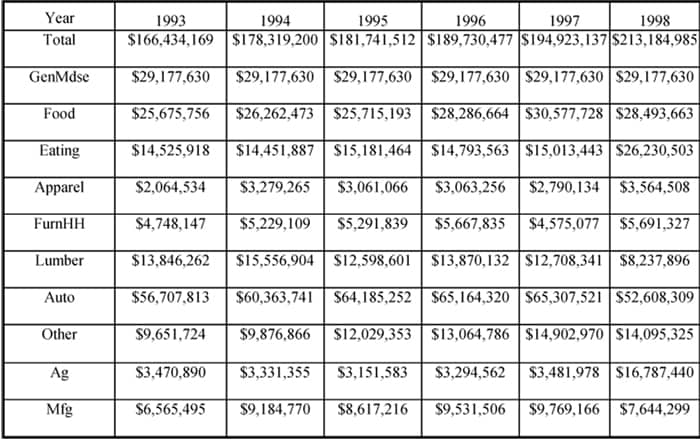
As shown in the chart below, the total retail sales for Morris from 1993 to 1998 increased $46,750,816 or 28 percent.
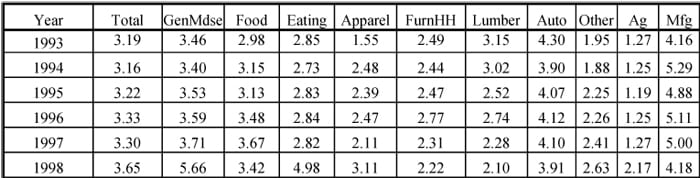
The pull factor is a comparison of average, downstate, per capita expenditures compared to local per capita expenditures. Pull factor calculations provide an indication of the shopping patterns of the local population. One (1) is the dividing line. A pull factor of less than one indicates that, on average, people are shopping outside the study area for those items. Conversely, a pull factor greater than one indicates that on average, people are coming from outside the study area for those items. The table below reveals that people have tended to stay within Morris to fulfill their shopping needs and draw people from outside of the city.
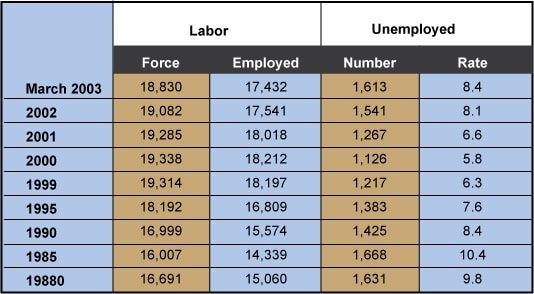
EMPLOYMENT
Grundy County ’s unemployment rate had been decreasing from 1985 to 2000 but has been on the rise the last 2 years. While the labor force has increased 15.9 percent (2,647 persons) from 1980 to 2000, the unemployment rate decreased four percent from 9.8 to 5.8. Since 2000, the labor force has declined by 508 while the unemployment rate has increase 2.6 %.